
Facebook Analytics: Unleashing the Power of your Data
Facebook Analytics is a comprehensive tool that allows you to visualize your entire sales funnel, understand the lifetime value of users, and see how your organic and paid strategies intersect.
This is a MUST LEARN for all Facebook and Instagram Marketers, big and small.
It’s a free tool, and the time you invest learning how to utilize it will definitely pay off.
As a consultant, I often receive questions from marketers trying to determine how data from Facebook is attributed in Google Analytics, and what they can do to better understand the full story.
Fortunately, Facebook Analytics unifies data across channels - including Facebook Pages and your website - so you can get the complete picture.
Just like any Analytics tool, you need to approach it with a business question.
Here’s are some examples of the questions Facebook Analytics can help you answer.
- Do people who ‘Like’ your ads actually buy anything?
- Are there pages on your website where users drop off more quickly than other pages?
- Is your check-out or cart process lowering conversion rate?
With Facebook Analytics you can easily build funnel, revenue, and retention reports to analyze performance and deep dive into specific audiences with precise segmentation tools.
Beyond that, the Automated Insights tool (Beta) uses advanced machine learning to automatically surface account optimization opportunities. For example, segments with the highest Average order Value. This allows you to get insights even faster, so you can start taking action.
If you’re advertising on Facebook or Instagram, Analytics will unleash loads of actionable data. However, one great thing about the Facebook pixel is that it records everything, regardless of advertising. Meaning, you’ll be able to get granular information about organic and paid visitors.
Ready to get started? Implementing and using Analytics is a three-step process.
If you have the Facebook Pixel Installed and customized, you’ve already completed step one.
The next step is to customize your Event Source Group (ESG), we’ll get their shortly.
From there, you’ll need to decide what business questions you would like to solve. I'll provide a few examples.
1. Visualizing your Entire Sales or Conversion Funnel
As Marketers, it’s important for us to map out the customer journey to conversion. However, it’s easy to miss some upper funnel actions that indicate a prospect is more likely to convert, as opposed to individuals who didn’t take that action. This is even more challenging when we’re analyzing data from several different sources.
Have you ever wondered if people who Reacted to your posts actually went to your website and bought something?
This Customer Journey data is possible with Facebook Analytics.

Having insight as to how effectively your upper funnel activities contribute to conversions will help you better design your overall marketing strategy.
With the Facebook Pixel events properly integrated, you’ll be able to see what happens within your Facebook funnel, and how it relates to your overall website funnel.
Facebook has detailed instructions on how to create and install a pixel, as well as how to make sure it's working.
I recommend implementing the following Facebook Pixel events:
- PageView
- View Content
- Add to cart
- Initiate Checkout
- Purchase
- Lead
The code for these events can be found within the Events Manager section in your ad account.

Once these events have been customized for your account, you’ll be able to surface clear, actionable data.
Here’s an example of a funnel showing people who visited a company’s website, then later used their app, and made a purchase.

You can build these within the ‘Funnels’ section of Facebook Analytics.

With the funnel below, we can easily visualize how many people commented on a post. From there, we can determine how many of those people went to your website. Finally, of those people who commented and went to your website, we can see how many made a purchase.
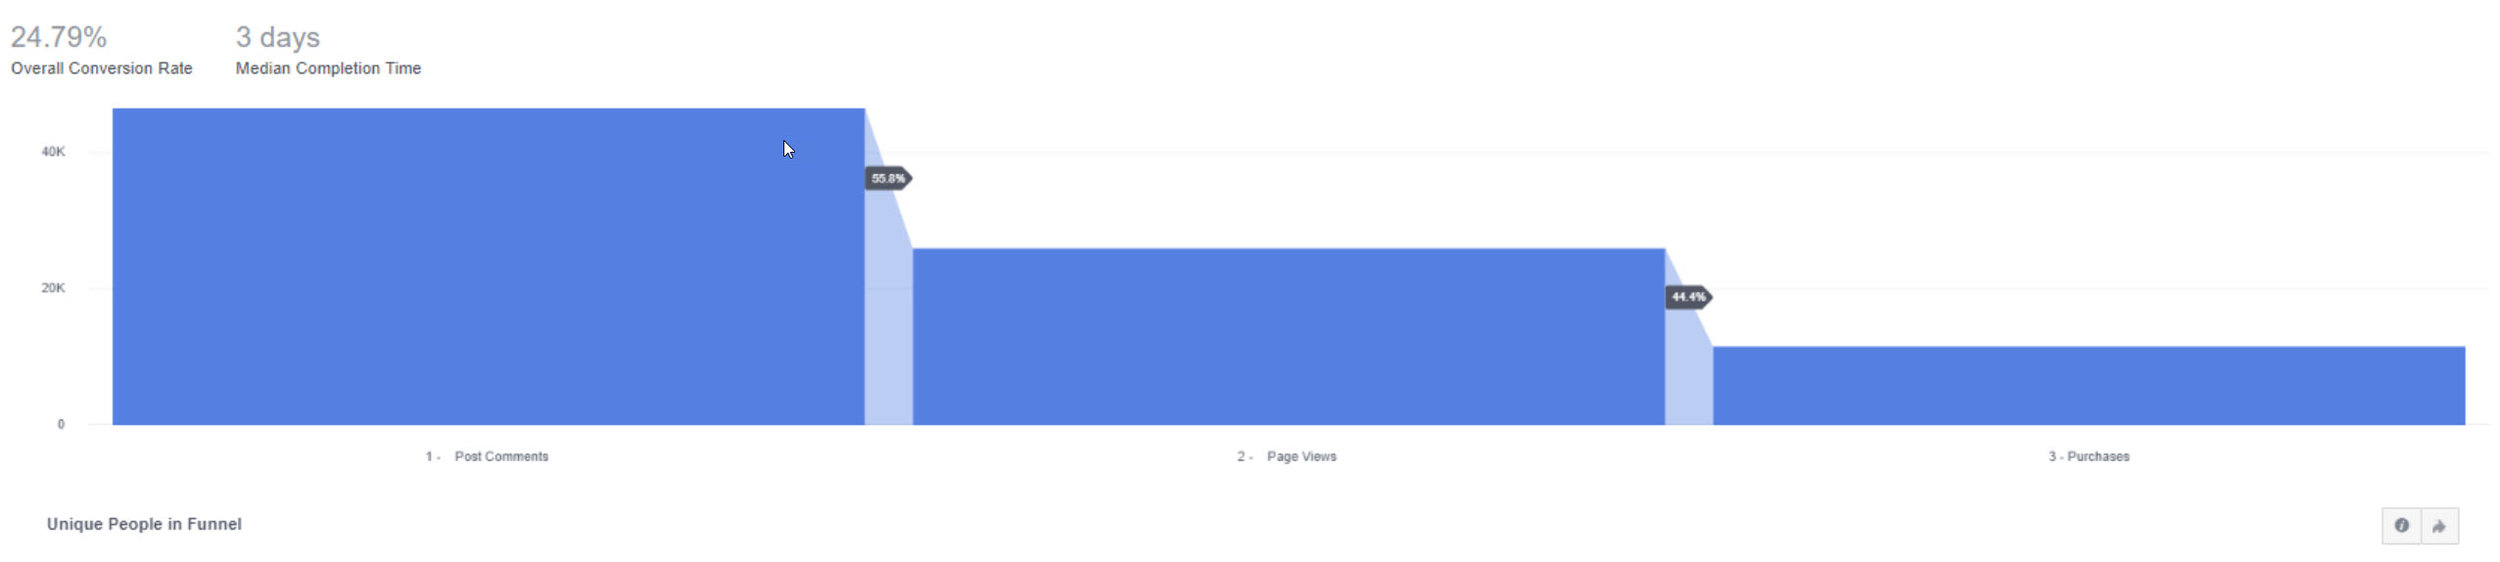
Here’s where it gets even more interesting, we can determine the overall Conversion Rate from people who make these comments (24.79%) as well as how long it takes to complete this conversion (3 days).
We can now start forecasting the number of conversions we’ll ultimately have, based on how many people we add to the top of our funnel.
We can also better determine our Key Performance Indicators, based on the actions that are more likely to result in a conversion.
2. Build Your Event Source Groups
We now know there’s a lot of cool stuff we can do with this data. But first, we have to connect data from multiple assets. These assets include your Pixel, Page, Offline Event Set and Mobile app. In short, everything Facebook could be measuring on your behalf. We can the aggregate this data by creating an Event Source Group (ESG). An ESG is a section within Facebook Business Manager accessible within the Business Settings section.

Once created, it allows you to group together all your event sources so you can view your customers' complete journey across multiple touch points.

From here, you’ll be able to search for your ESG in Analytics to easily build funnel, revenue, and retention reports.

There you go. You’re finally able to get the complete picture and discover valuable insights.
3. Data Visualization to Surface and Illustrate Key Findings
As I said before, we need to approach this tool with a business question. Otherwise, you can easily get overwhelmed with all the data available.
You'll now need to consider what questions you would like to answer. For example:
- What upper funnel actions do I want to monitor?
- Where am I losing people in the conversion funnel?
- How can I get more high-quality engagement, which ultimately leads in a conversion?
Do you want to compare one segment of users against another? Do you or your stakeholders like bar charts, graphs, or tables? You can do all of this with Facebook Analytics.
For example, here’s a Lifetime Value Graph that shows when the most valuable customers came in, and the revenue they’ve generated over time.
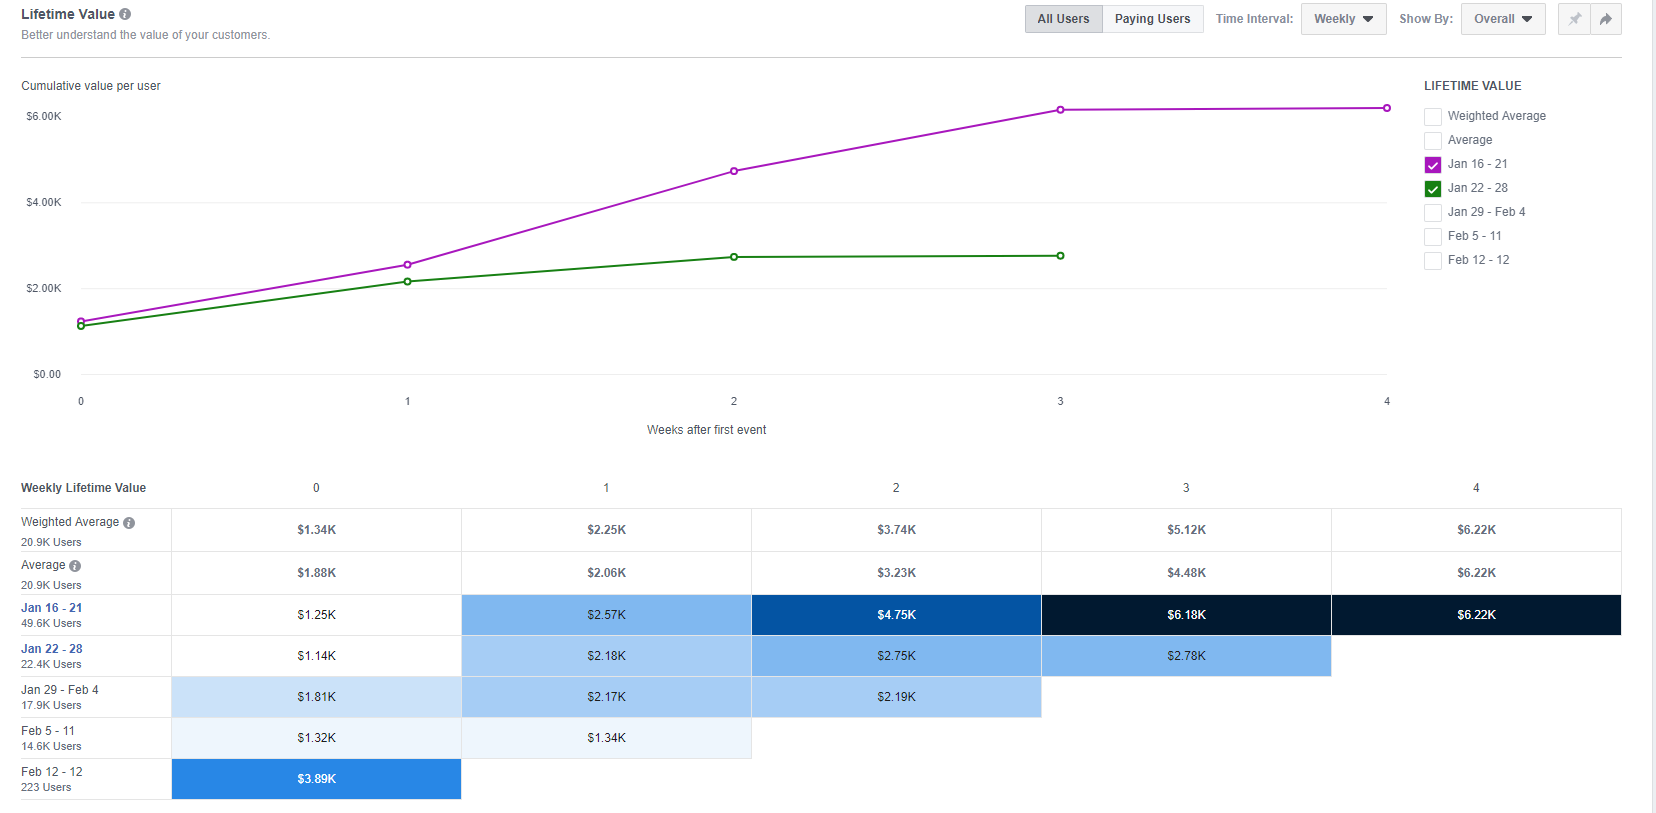
The purple line on top shows people who made a purchase from January 16th – 21st.
The green line shows people who made a purchase from January 22nd – 28th.
Notice, individuals who made a purchase the week of January 16th – 21st have a higher Lifetime Value.
Let’s zoom in the Cohort Analysis to unpack this a bit more.
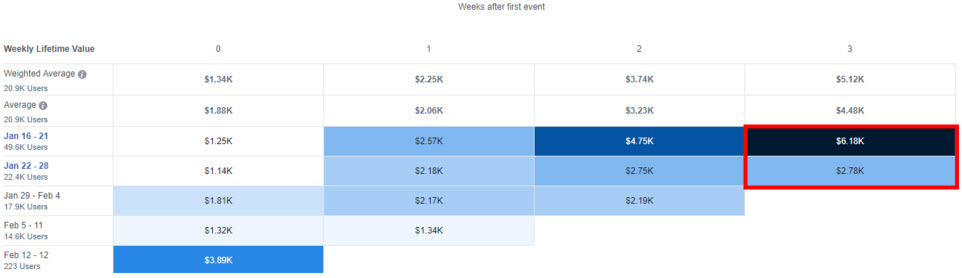
- People who made a purchase January 16th – 21st had a total Lifetime Value of $6.18k after 3 weeks.
- People who made a purchase January 22nd – 28th had a total Lifetime Value of $2.78k after 3 weeks.
Therefore, we’ll want to focus on replicating the practices that got us these higher value customers.
Perhaps it was a call to action, or the products featured?
Maybe offering a huge discount to get new customers wasn’t such a great idea after all?
Either way, you’ll now have data to back your decision-making process.
You can customize how your data is presented. Once you have a few setup, you can even create your own Facebook Analytics dashboard.
This dashboard will dynamically update, so you’ll always have the latest data to share with your clients, internal stakeholders, or for your own analysis. I suggest making a presentation-ready dashboard for stakeholders who focus on the bottom line as opposed to analysis. Highlight your main KPIs and provide a summary of the actions you'll take as a result of your analysis.
What’s next?
These are just a few of the amazing features available within Facebook Analytics. Beyond that, this is a constantly evolving platform, so keep an eye out for updates.
Check out my Facebook Analytics presentation for additional use cases and implementation tips.
About me
I’m a former Facebook employee, and a Certified Facebook Advertising professional. Over the years, I’ve trained thousands of individuals, and worked with multiple agencies and teams.
I know Facebook Marketing can be challenging, but if you have the determination, I can guide you through the process. One of the most rewarding aspects of my job is helping people finally ‘get it’, so they can apply their business knowledge to creating profitable campaigns.

Here's what people are saying:
"Although I was already experienced with Facebook Marketing, speaking with Terry helped me better understand some of the more advanced and nuanced processes. He has a very clear and engaging style of communication, which comes in handy when discussing technical content."
Grace Rusch
Marketing Specialist - Gartner
Interested in chatting about my other services?
It all starts with filling out the form below. We’ll then schedule a discovery call so I can get a better understanding of your business, and goals. You can also learn more about me and my approach.